Real estate downturns are rare but impactful events that reshape communities and economies. Unlike stock fluctuations, these shifts often stem from interconnected factors like economic imbalances, speculative activity, and policy changes. The 2007-2008 collapse, triggered by risky loans and inflated home values, remains a stark reminder of how quickly stability can unravel.
At Babcock Ranch Homes, we believe knowledge is power. By analyzing patterns from past events, buyers and investors gain clarity on warning signs like rapid price surges or lax lending standards. Our team in Babcock Ranch, Florida, combines decades of expertise with up-to-date market insights to help clients navigate uncertainty.
This article breaks down key drivers of real estate instability. You’ll learn how employment rates, interest hikes, and external shocks—like natural disasters—influence property values. We’ll also explore how communities like ours prioritize sustainable growth to mitigate volatility.
Key Takeaways
- Real estate downturns occur less frequently than stock crashes but create lasting economic effects.
- Historical examples highlight the role of speculation and risky financial practices in market instability.
- Economic indicators like unemployment and interest rates serve as early warning signals.
- Babcock Ranch Homes offers localized expertise to help buyers make informed decisions.
- External factors, including environmental risks, increasingly shape property value trends.
Introduction to Housing Market Dynamics
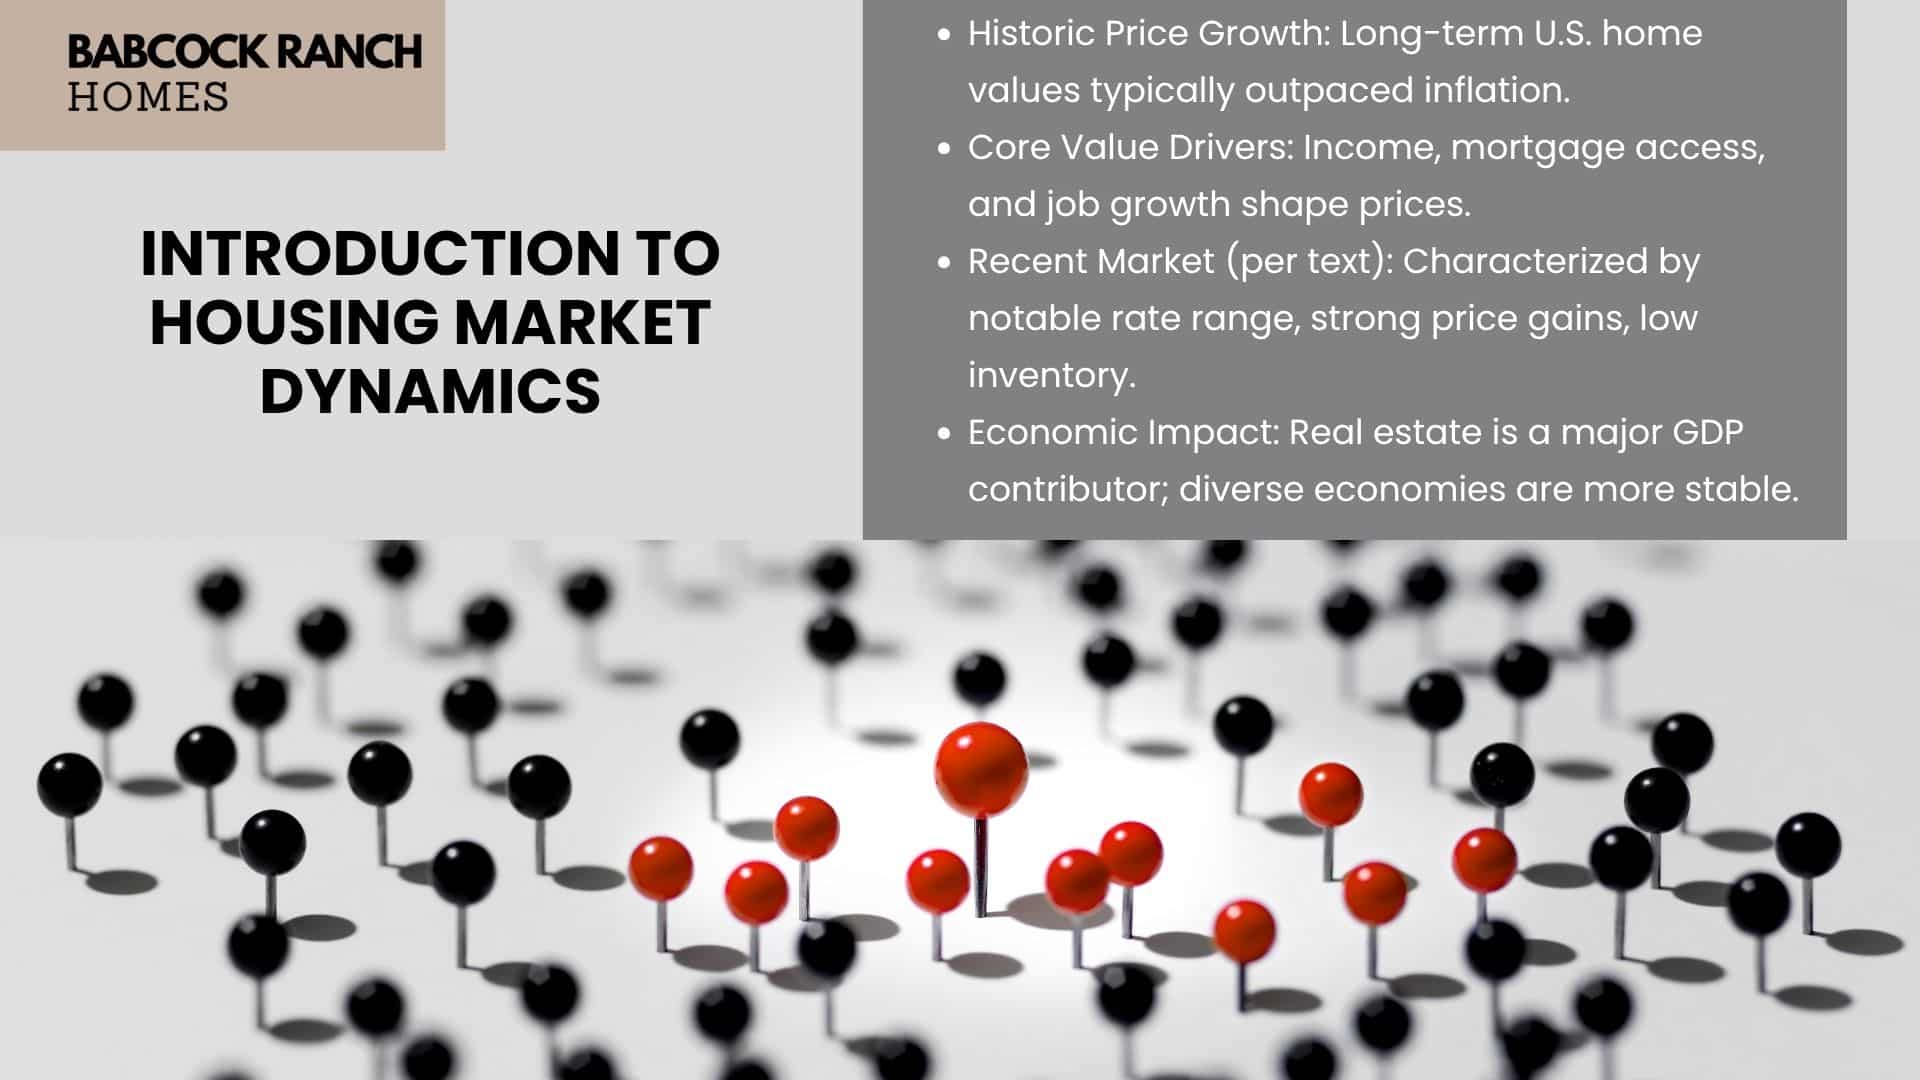
Real estate values don’t exist in a vacuum—they’re shaped by decades of economic patterns and consumer behavior. Over the past 30 years, U.S. home prices rose 4.6% annually on average, outpacing inflation by nearly 2%. This growth reflects shifting priorities: remote work, demographic changes, and evolving lifestyle preferences.
Overview of Market Trends
Three forces dominate modern property valuation: disposable income levels, mortgage accessibility, and regional job growth. When these align, demand surges. For example, 2020-2022 saw record-low interest rates (below 3%) paired with millennial homebuying peaks, pushing prices up 34% nationally.
| Factor | 1990-2000 | 2010-2020 | 2020-Present |
|---|---|---|---|
| Interest Rates | 8.1% avg | 3.9% avg | 4.5-7.1% |
| Price Growth | 2.8% annual | 4.1% annual | 6.3% annual |
| Inventory Levels | 6-month supply | 4.5-month supply | 2.9-month supply |
Significance of Housing in the U.S. Economy
Property markets drive 15-18% of GDP through construction, banking, and retail sectors. Babcock Ranch Homes analysts emphasize how sustainable communities balance growth with infrastructure—a key lesson from Sun Belt expansions where prices rose 58% since 2015.
Understanding these fundamentals helps buyers spot opportunities. As one industry report notes: “Regions with diversified employment bases weather economic shifts better than those reliant on single industries.”
Economic Indicators and Their Influence on Home Prices
Understanding economic signals helps buyers anticipate shifts in property values. Three key factors—borrowing costs, employment trends, and central bank decisions—create ripple effects across neighborhoods. Let’s explore how these elements shape affordability and demand.
Role of Mortgage Rates and Federal Reserve Policies
Interest rates directly affect monthly payments. A 1% rate increase on a $300,000 loan adds $179 to payments—enough to disqualify 12% of buyers, according to National Association of Realtors data. The Federal Reserve’s rate adjustments aim to balance inflation and economic growth.
“When rates rise too quickly, it cools demand. Our 2022 policy shifts prevented overheating without destabilizing markets,” notes a Federal Reserve report.
| Period | Avg 30-Year Rate | Home Price Change |
|---|---|---|
| 2010-2015 | 4.1% | +18% |
| 2016-2020 | 3.8% | +29% |
| 2021-2023 | 5.4% | +14% |
The Impact of Economic Recession and Unemployment
Job losses reduce buying power. During the 2008 crisis, every 1% unemployment rise correlated with a 3.2% drop in property values. Today, regions with diverse industries—like tech hubs—show more resilience than areas dependent on single sectors.
Consider these patterns:
- Recessions typically lower prices by 8-12% within 18 months
- Markets with stable employment recover 22% faster
- Remote work trends now buffer some locations from localized downturns
By monitoring these indicators, buyers can time decisions strategically. Babcock Ranch Homes advisors track regional data to help clients identify stable opportunities amid fluctuations.
What causes Housing Market Crashes
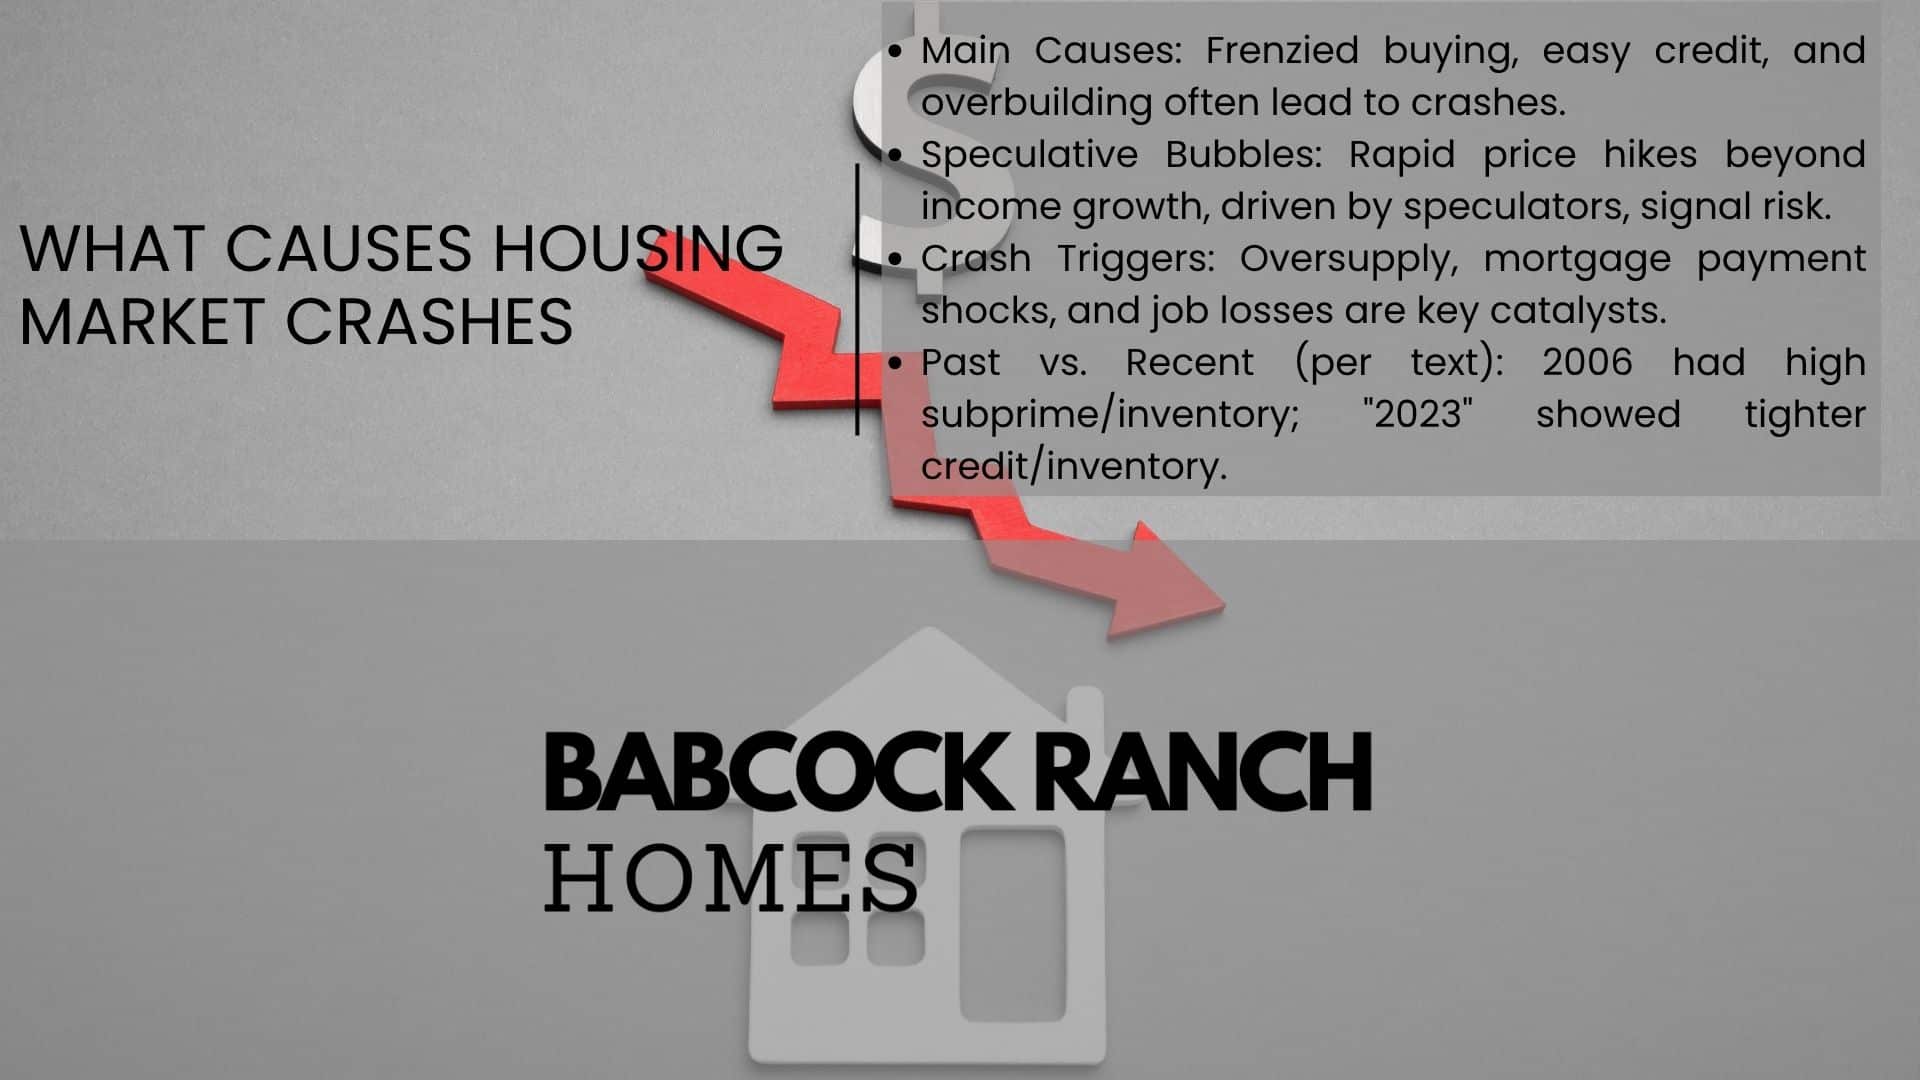
When speculation outpaces reality, property values face inevitable corrections. Three elements often collide: buyer frenzy, loose credit policies, and construction surges that ignore actual needs. These forces create instability that ripples through communities and financial systems.
Understanding the Underlying Pressure Points
Rapid price growth frequently signals trouble. From 2000 to 2006, U.S. home values jumped 80% nationally—far exceeding income growth. Speculative investors then accounted for 28% of purchases, according to CoreLogic data. When demand relies on future appreciation rather than practical use, bubbles form.
Key triggers include:
- Oversupply from aggressive building during peak demand
- Adjustable-rate mortgages resetting to unaffordable payments
- Job losses reducing buyer capacity during economic shifts
Historical Case Studies and Lessons Learned
The 2007-2009 collapse offers clear warnings. Subprime loans comprised 25% of 2006 mortgages—up from 8% in 2001. As defaults rose, prices plunged 33% by 2009. A Federal Reserve review states: “Relaxed income verification and high-risk products magnified losses when rates adjusted.”
| Factor | 2006 Peak | 2023 Comparison |
|---|---|---|
| Subprime Mortgages | 25% of loans | 5% of loans |
| Price Growth (5-year) | +80% | +34% |
| Inventory Levels | 7-month supply | 2.9-month supply |
Today’s stricter lending standards and balanced inventory help prevent repeat scenarios. Babcock Ranch Homes analysts stress monitoring loan practices and regional supply-demand ratios to identify sustainable opportunities.
Factors Contributing to Housing Bubbles
Real estate expansions often reach unsustainable peaks when optimism overshadows economic reality. Prices climb faster than incomes, drawing investors seeking quick profits rather than long-term value. This imbalance creates conditions where even small economic shifts can trigger sharp corrections.

Rapid Price Appreciation and Excessive Demand
Home values rising 15-20% annually—as seen in Phoenix (2021) and Miami (2005)—signal overheating. Buyers rush to secure properties before being priced out, creating artificial scarcity. By late 2022, 42% of U.S. homes sold above asking price compared to 24% in 2019.
| Market Cycle | Annual Price Growth | Investor Purchases | Months of Inventory |
|---|---|---|---|
| 2006 Peak | 12.4% | 28% | 6.5 |
| 2023 | 5.7% | 18% | 3.1 |
The Role of Speculative Behavior
Flippers and short-term investors amplify price swings. During Las Vegas’ 2004-2006 boom, 35% of buyers planned to resell within a year. When demand slowed, these speculators flooded the market with listings, accelerating price declines.
Key patterns emerge in overheated markets:
- Prices grow 3x faster than local wages
- New construction focuses on luxury units
- Mortgage approvals rely on future appreciation assumptions
Babcock Ranch Homes advisors monitor these trends to help buyers avoid overpaying. As one Federal Reserve study notes: “Markets correcting from speculative peaks typically take 4-7 years to regain previous price levels.”
Risky Lending and Its Consequences
Lending practices can act as accelerants in real estate cycles, amplifying both growth and decline. When financial institutions prioritize volume over stability, entire communities face lasting repercussions. The 2007-2008 crisis remains the clearest example of how relaxed standards create systemic risks.
Subprime Lending Pitfalls
Subprime mortgages—loans issued to borrowers with poor credit—accounted for 1 in 4 home purchases during the mid-2000s boom. These high-risk products often featured adjustable rates that reset to unmanageable payments. By 2009, 23% of subprime borrowers faced foreclosure compared to 5% of prime loan holders.
| Metric | 2006 Data | 2023 Data |
|---|---|---|
| Subprime Share | 25% | 6% |
| Avg Down Payment | 2% | 13% |
| Foreclosure Rate | 4.6% | 0.3% |
Impact of Relaxed Credit Standards
Easier approvals initially boosted homeownership rates to 69% in 2004. However, “no-doc” loans and low down payments left many unprepared for economic shocks. A Federal Reserve study found 40% of 2006 borrowers couldn’t afford their homes after rate adjustments.
Key outcomes included:
- 2.3 million foreclosures filed in 2008 alone
- Property values dropping 33% nationwide
- Unemployment doubling to 10% by 2009
Today’s stricter regulations—like mandatory income verification—help prevent repeat scenarios. Babcock Ranch Homes emphasizes responsible borrowing to protect both individuals and community stability.
Supply and Demand Dynamics in Real Estate
Property values hinge on a delicate balance between available homes and eager buyers. When inventory shrinks, competition intensifies—pushing prices upward even in stable economic conditions. Zoning restrictions and geographical barriers often limit new construction, creating persistent shortages in high-demand areas.
Local Market Conditions and Limited Inventory
Metro areas like Austin and Seattle saw prices jump 22% in 2022 despite rising mortgage rates. Why? Active listings fell 52% compared to pre-pandemic levels. This scarcity forces buyers to act quickly, with 63% of homes selling within two weeks according to National Association of Realtors data.
Three factors deepen supply-demand imbalances:
- Strict zoning laws delaying multi-family housing projects
- Construction labor shortages adding 4-7 months to build timelines
- Geographical constraints in coastal cities limiting expansion
| City | Months of Inventory (2023) | Annual Price Growth |
|---|---|---|
| Miami | 1.8 | +9.1% |
| Nashville | 2.3 | +6.7% |
| San Francisco | 3.1 | +2.4% |
Low inventory markets reward prepared buyers. Babcock Ranch Homes advisors analyze neighborhood-specific trends to identify properties with sustainable demand. As one industry expert notes: “Areas with under 3 months of supply typically see 5-8% annual appreciation—twice the national average.”
Understanding these patterns helps avoid overpaying during bidding wars. Strategic buyers focus on communities with planned infrastructure improvements that address long-term housing needs.
Impact of External Shocks on the Housing Market
External shocks disrupt the delicate balance of property markets. Events like hurricanes, pandemics, or political conflicts can reshape supply, demand, and lending practices within months. These disruptions often reveal hidden vulnerabilities in regional economies.
Natural Disasters, Geopolitical Events, and Unexpected Shifts
Hurricane Katrina (2005) flooded 80% of New Orleans homes, causing a 19% price drop in affected areas. Meanwhile, unaffected neighborhoods saw values rise 8% due to sudden scarcity. Such events force lenders to tighten standards, reducing approvals by 22% in high-risk zones.
The COVID-19 pandemic triggered contrasting trends. Urban rents fell 12% as remote workers fled cities, while suburban prices jumped 15%. Mortgage forbearance programs temporarily reduced foreclosures, but 7% of borrowers still faced delinquency by 2021.
| Event | Home Price Change | Inventory Shift | Mortgage Rate Impact |
|---|---|---|---|
| 2017 California Wildfires | -14% (burn zones) | +28% statewide | 0.5% increase |
| 2022 Ukraine Conflict | +6% (Midwest energy hubs) | -9% (construction delays) | No direct effect |
| 2020 COVID Lockdowns | +5% national average | -34% active listings | 0.75% decrease |
Geopolitical tensions create indirect pressure. The 2022 energy crisis boosted Texas home prices near oil fields by 11%, while Northeast heating costs strained buyer budgets. Savvy investors monitor regional risk factors rather than reacting to headlines.
While shocks create volatility, they also reveal opportunities. Markets with flexible zoning laws and diverse economies typically recover fastest. Babcock Ranch Homes helps clients navigate these shifts with hyperlocal data and disaster-resilient community planning.
Long-Term Market Trends and Mean Reversion
Home values rarely stray far from historical norms over extended periods. Since 1987, U.S. prices have averaged 3.8% annual growth—closely tracking inflation plus 1.5%. This pattern reflects mean reversion, where extreme highs or lows eventually return to established baselines.
Understanding Mean Reversion in Home Prices
Historical data reveals consistent corrections. Phoenix home values surged 127% from 2000-2006, then dropped 48% by 2012. By 2020, they stabilized near the 30-year average of 4.1% annual growth. Similar patterns emerged in Miami (2008-2018) and Las Vegas (2010-2022).
| Market | Peak Growth | Correction Period | Long-Term Average |
|---|---|---|---|
| Phoenix | +22% (2005) | 2007-2011 | 4.3% |
| Miami | +28% (2006) | 2008-2011 | 3.9% |
| Seattle | +19% (2022) | 2023-2026* | 5.1% |
Data-Driven Predictions for Future Market Behavior
Current prices sit 12% above the 40-year trendline according to Federal Reserve models. While temporary factors like low inventory sustain elevated values, analysts expect gradual alignment by 2027-2029.
Three scenarios could accelerate mean reversion:
- Mortgage rates stabilizing near 5.5%
- Construction catching up to household formation rates
- Investor activity dropping to pre-2020 levels
As a 2023 Case-Shiller Index report notes: “Markets overshooting fundamentals by over 15% historically correct within 5-8 years.” Buyers should prioritize areas with balanced supply-demand ratios and diversified employment bases for lasting value.
Conclusion
Navigating real estate cycles requires understanding patterns that shape stability and risk. Economic shifts, lending practices, and unexpected events—from job losses to natural disasters—all influence property values. Historical data shows markets often self-correct: rapid growth phases typically balance through gradual adjustments or sharper corrections.
Key indicators like mortgage rates and employment trends remain critical for timing decisions. While stricter regulations prevent repeat scenarios like the 2008 crisis, external shocks still test market resilience. Communities with diversified economies and disaster-ready infrastructure often recover faster from downturns.
Babcock Ranch Homes combines hyperlocal expertise with national trend analysis to help buyers make confident choices. Whether evaluating interest rate impacts or assessing inventory levels, our team provides actionable insights tailored to Florida’s evolving landscape.
For personalized guidance, call 518-569-7173. Knowledge transforms uncertainty into opportunity—let’s build your strategy together.


