Property prices go up and down, but real estate bubbles can change whole economies. The 2008 housing crash took $11 trillion from household wealth, the IMF found. Now, U.S. home prices have risen 45% from 2020, raising questions about growth and risk.
Market corrections are common, but bubbles form when prices don’t match income or rental yields. Investors often overlook early signs because housing market trends seem too good to last. Bubbles usually last 5–7 years before they burst, studies show, bringing both dangers and chances.
To understand these cycles, we need more than just numbers. We must ask why buyers pay more in shortages, how loans fuel booms, and when people’s needs change. This guide helps you spot real trends from just temporary highs.
Key Takeaways
- Major real estate bubbles occur roughly every 15–20 years, based on IMF historical analysis
- Current price-to-income ratios sit 28% above 2006 peaks in some U.S. markets
- Case-Shiller Index data reveals regional price variations exceeding 300% from 2012
- Bubble duration averages 5–7 years before significant correction phases begin
- Investor strategies differ fundamentally between stable markets and bubble conditions
What Is a Real Estate Bubble
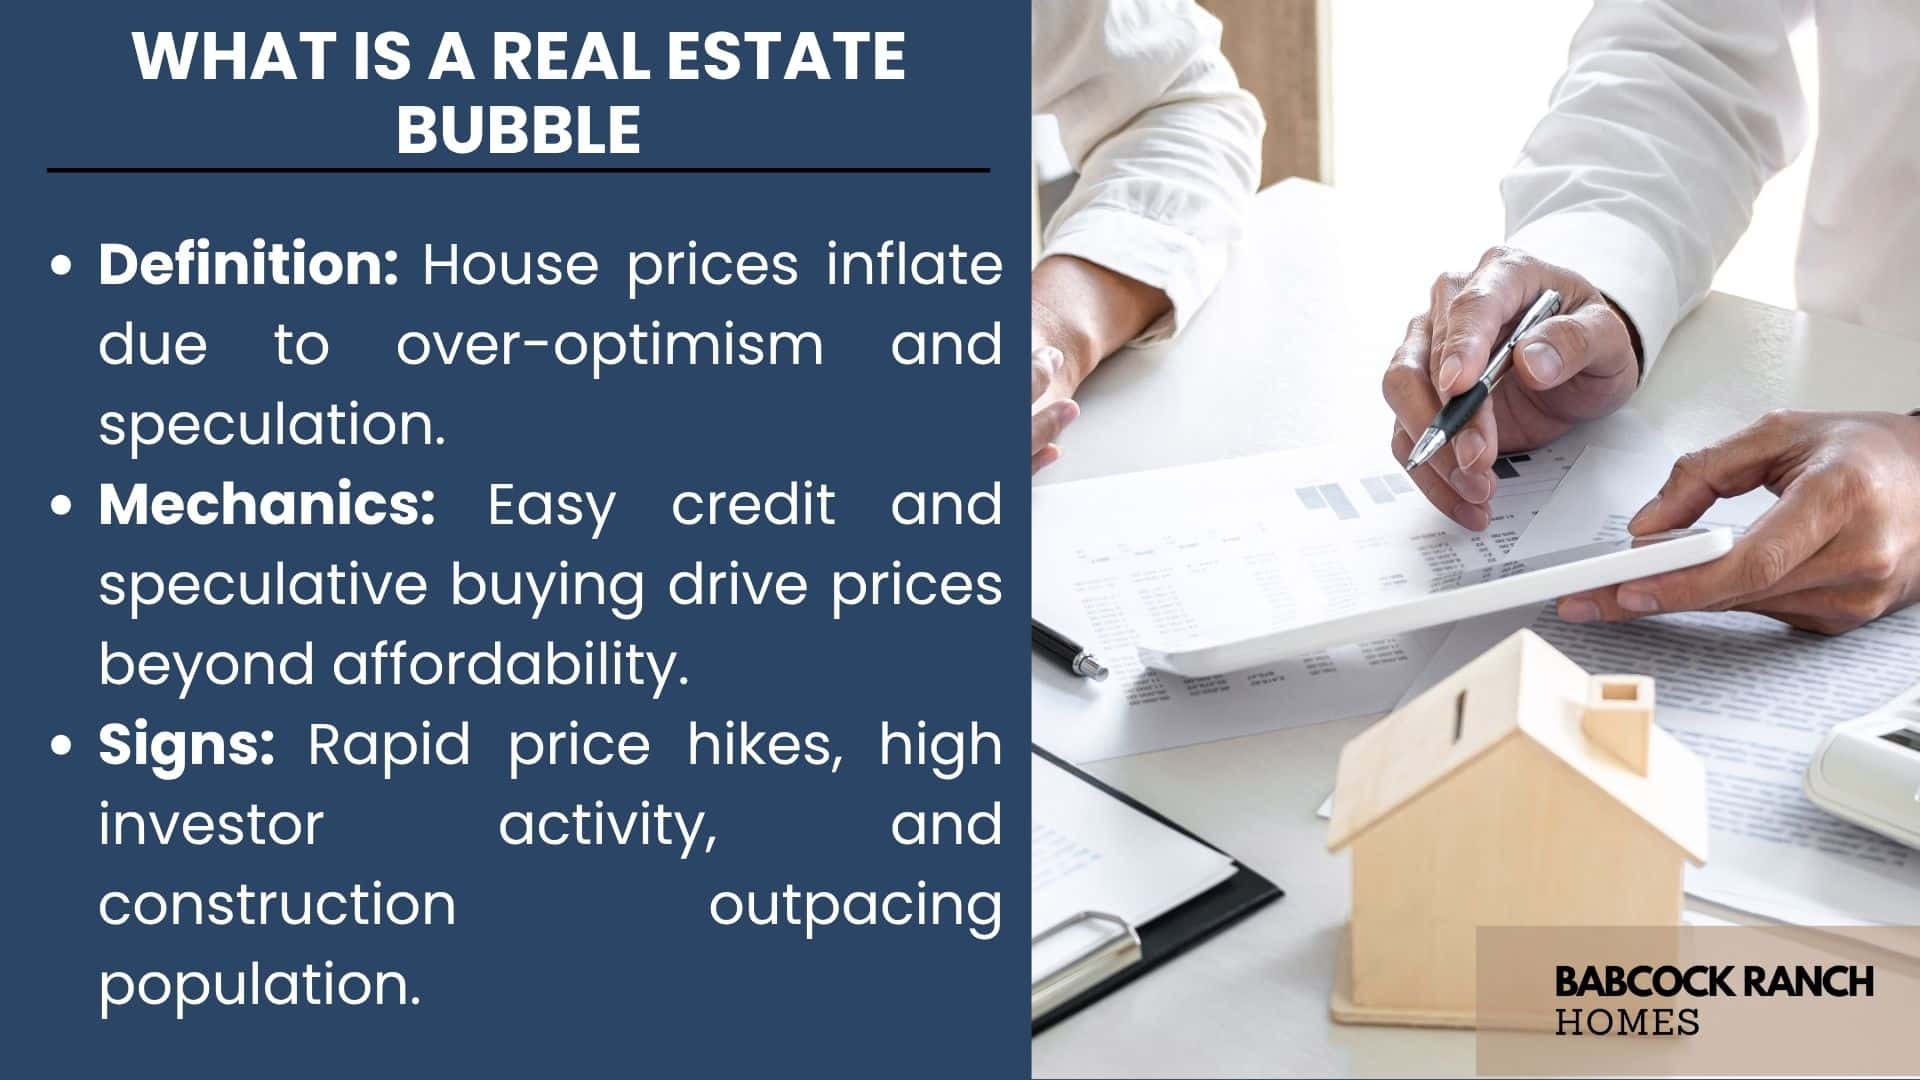
How do housing markets turn from stable to risky? A real estate bubble happens when house prices go up too high. This is because of excessive optimism among buyers and lenders. It creates a cycle where higher prices lead to more risk.
Definition and Basic Mechanics
An economic bubble in housing starts with easy credit, speculative buying, and prices that don’t match reality. Banks make it easier for people to get mortgages. Investors look for quick gains, not long-term value. This leads to prices that don’t match what people can afford.
Think about the 2008 crisis. Easy loans let unqualified buyers get homes, pushing prices up. But when mortgages adjusted and defaults rose, the market changed fast. This shows how bubbles need more credit to keep growing.
Key Characteristics of Housing Bubbles
Spotting a housing bubble means looking for certain signs:
- Prices rising 20%+ annually in stable markets
- Investors outnumbering primary homeowners in purchases
- Construction permits outpacing population growth by 3:1
- Media headlines promoting “can’t-lose” property investments
These signs lead to a cycle where buyers rush in, pushing prices up. But when credit tightens or the economy changes, the bubble bursts. Owners are left with homes worth less than their mortgages.
Historical Examples of Property Market Collapses
Two major events in economic history show the risks of unchecked real estate speculation. These examples show how market excitement and structural weaknesses can cause huge real estate bubble bursts. By studying these events, investors can learn how to avoid similar problems today.
2008 U.S. Housing Crisis Breakdown
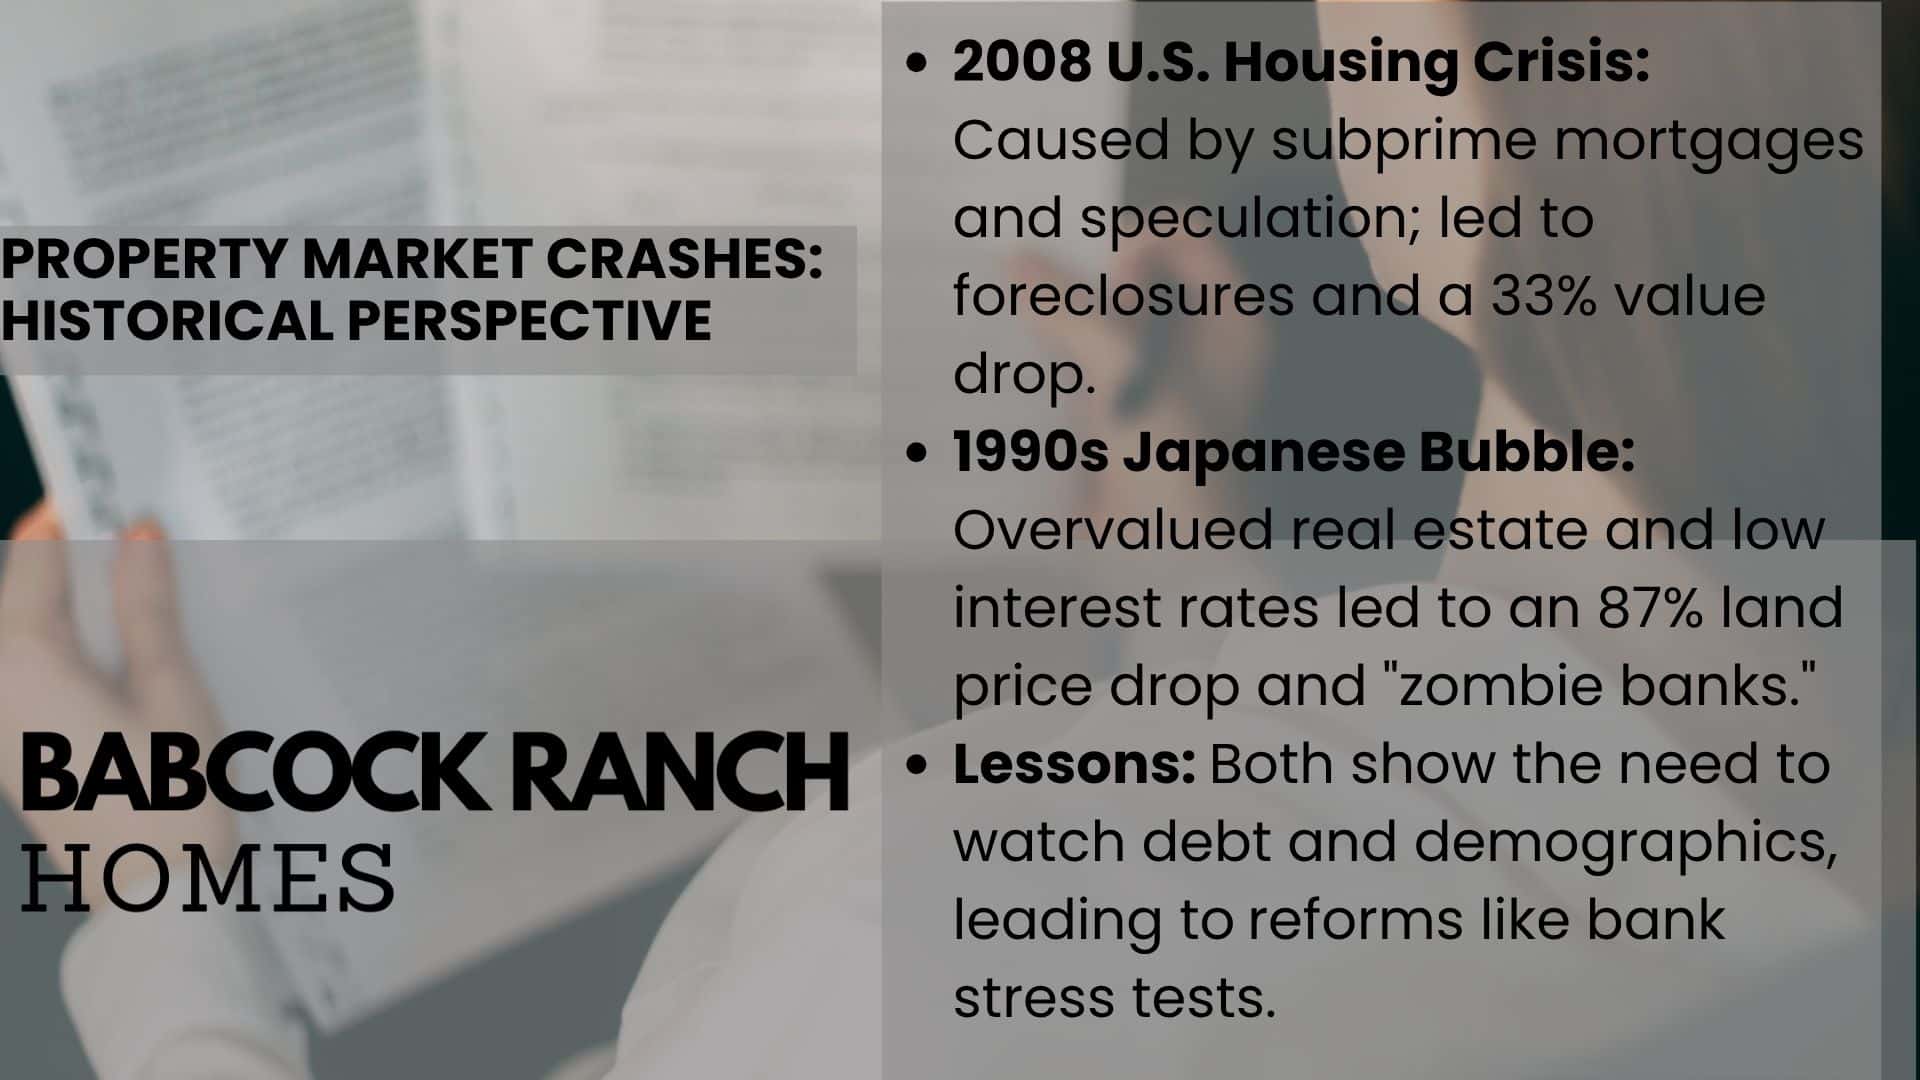
The U.S. housing market collapse led to a global financial crisis. Between 2007-2010, over 4 million homes entered foreclosure, with property values falling 33% nationwide. Three main factors caused this disaster:
- Subprime mortgage approvals for borrowers with poor credit
- Deregulated derivatives trading of mortgage-backed securities
- Speculative flipping of residential properties
After the crisis, reforms like the Dodd-Frank Act made lending stricter. But, recovery took nearly a decade in places like Nevada and Florida.
1990s Japanese Asset Price Bubble
Japan’s “Lost Decade” started when Tokyo commercial land prices fell 87% from 1991-2000. The collapse was due to:
- Overvaluation of real estate as collateral for corporate loans
- Central bank policies keeping interest rates artificially low
- Aging population reducing housing demand
This real estate bubble burst led to “zombie banks” with bad loans, delaying recovery until the 2000s. Japan then used urban redevelopment and stricter property valuation rules to respond.
Both crises highlight the need to watch debt levels and demographic trends. After these collapses, new rules were made. Now, major banks must pass stress tests to prevent failures during downturns.
Primary Drivers of Housing Market Bubbles
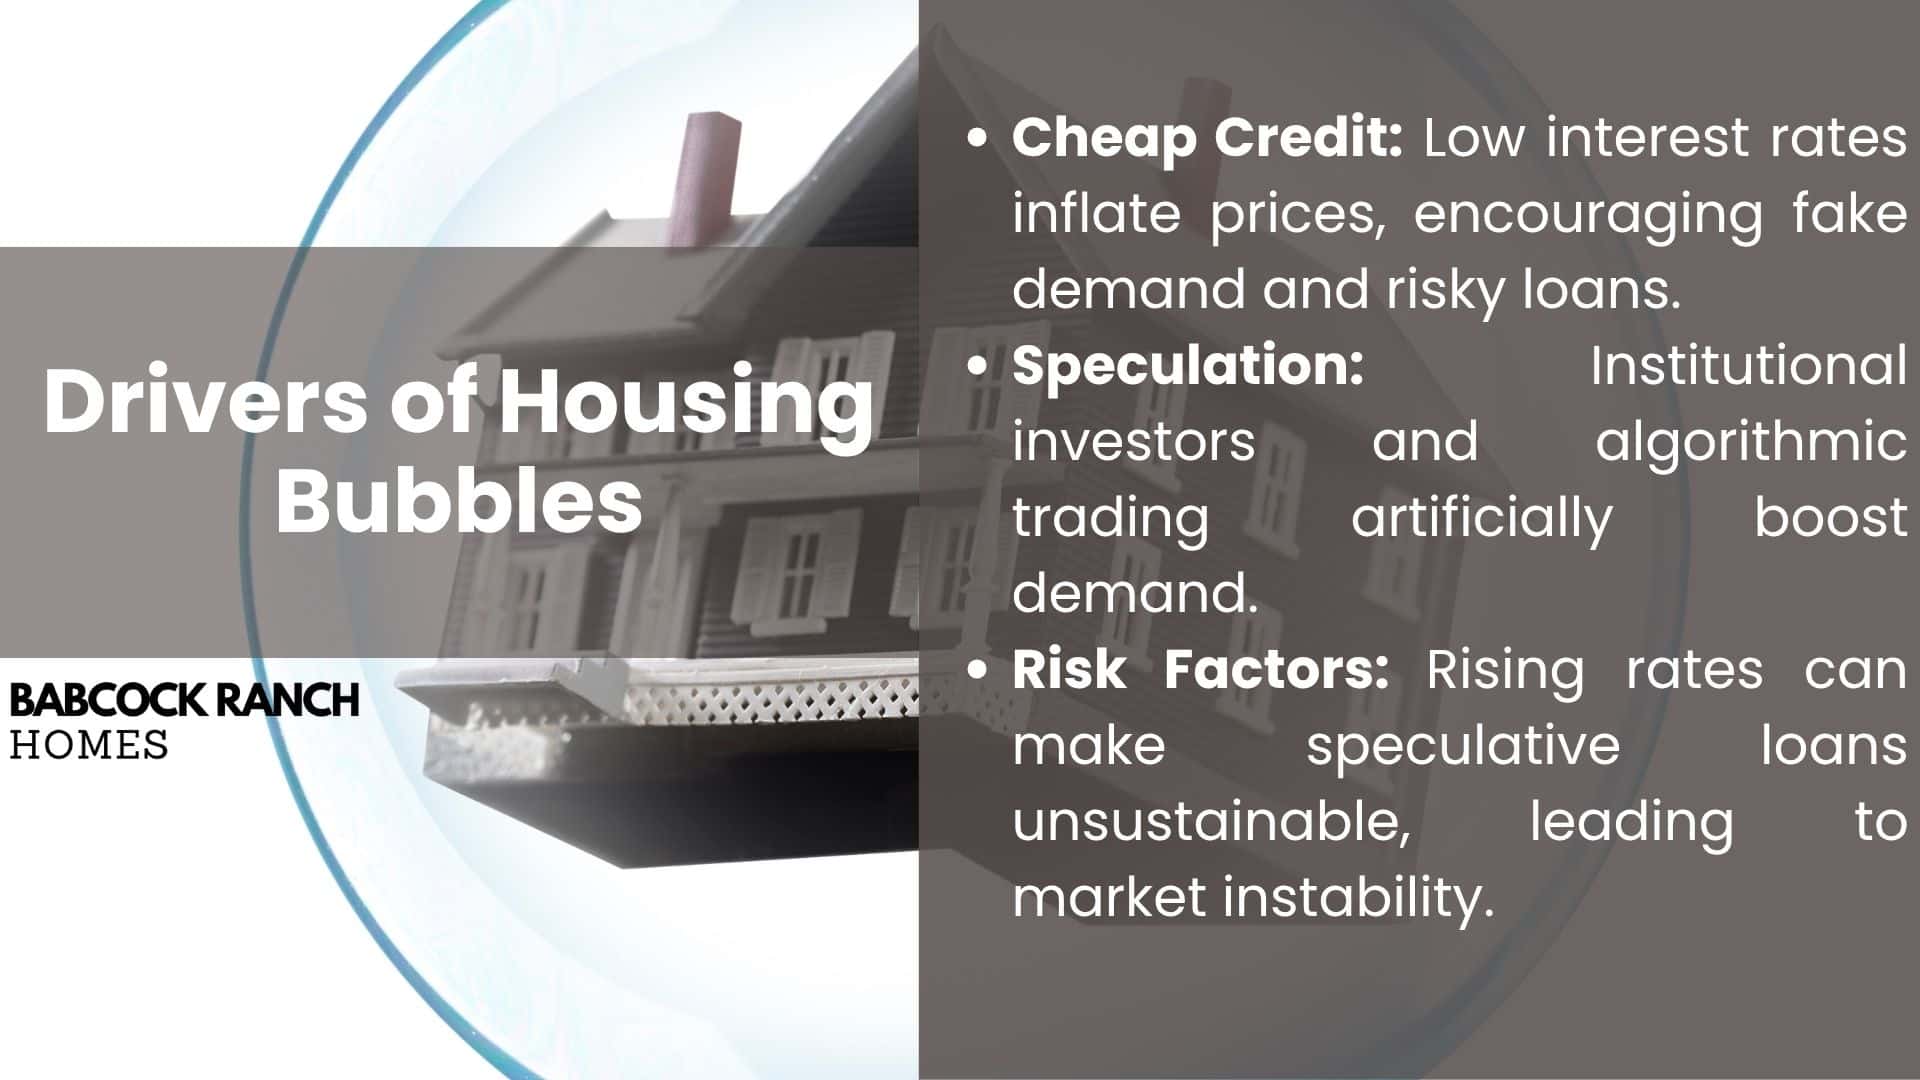
Understanding what drives prices up is key for investors. Two main forces create housing bubbles: cheap credit and risky speculation.
Low Interest Rate Environments
Low borrowing costs from central banks can lead to high housing prices. The Federal Reserve’s low rates from 2008 to 2015 caused:
- 40% increase in mortgage applications
- 15% rise in average home prices adjusted for inflation
- Subprime lending revival through non-QM loans
Recent research from the Philadelphia Fed found 23% of homes bought by investors in 2021 were through occupancy fraud. This means borrowers lied about living in the homes to get lower rates. This fake demand vanishes when rates go up.
Speculative Investment Patterns
Today’s speculation is more than just flipping houses. Institutional investors now buy 28% of U.S. homes through:
- Bulk buying entire neighborhoods
- Algorithmic price manipulation
- Rent-to-own schemes with inflated future values
In the 2020-2022 boom, places like Phoenix saw 43% of sales to investors, not homeowners. These deals often use adjustable-rate loans. When the Fed raises rates, these loans become harder to manage.
Smart investors watch debt-to-income ratios and rental vacancy rates. Markets with high prices and vacancies show signs of speculation, not real demand.
Warning Signs of a Market Bubble
Smart investors watch for signs of market bubbles. They look at housing affordability and development patterns. This helps spot problems before they get worse.
Price-to-Income Ratio Analysis
This key metric compares home prices to what people earn. If prices rise faster than wages for 3 years, it’s a red flag. Detroit’s homes are now 40.79% more expensive than they were in 2021, but wages haven’t kept up.
To check your area’s ratio, follow these steps:
- Find the median home price (Zillow or Realtor.com)
- Divide by the median household income (Census data)
- Compare it to past numbers
In 2024, some cities are way overvalued:
- Boise, ID: 6.2:1
- Austin, TX: 5.8:1
- Phoenix, AZ: 5.5:1
Construction Permits vs Population Growth
Building projects take 18-24 months to finish. If permits go up too fast, there might be too many homes. Watch these signs:
- Monthly building permits (Census Bureau data)
- Annual population change estimates
- Vacancy rate trends
- Average permit approval timelines
In Southwest Florida, permits jumped 43% but the population barely changed. This led to 8,000 empty homes. A high ratio means too many homes might be built soon.
(New housing units approved ÷ Population growth) × 100 = Supply ratio
If the ratio is over 120%, there could be too many homes in 2-3 years.
Risks for Investors During Bubble Periods
Real estate bubbles pose big challenges, making housing prices not match economic facts. Investors face big risks when markets get too hot. This includes sudden drops in value and unpredictable tenant actions. Knowing these risks helps you plan better before the market changes.
Negative Equity Scenarios
When housing prices fall fast, homes might be worth less than what owners owe. This can lead to some owners choosing to default on their loans. In the 2008 crisis, 14% of underwater mortgages saw this happen. Investors with many properties could face big financial problems if values drop too low.
Rental Market Volatility Factors
Bubble conditions mess up rental demand patterns. Markets with too many homes see high vacancy rates. Economic downturns make tenants want to rent smaller places. Test your income plans against three key models:
- Rent price sensitivity to local job losses
- Competition from new construction
- Mortgage rate adjustments impacting tenant affordability
Properties in areas with slow wage growth often do poorly during downturns. So, it’s key to check the location before investing in rentals.
Babcock Ranch Case Study: Sustainable Growth Model
In Southwest Florida, Babcock Ranch is a standout. It’s America’s first solar-powered town. This community shows how to build homes that last and protect the environment. Let’s look at three key points that make it a model for growth.
Solar-Powered Community Infrastructure
Babcock Ranch Homes boasts 343 acres of solar panels. These panels generate 150 megawatts, enough for 30,000 homes. This green energy system offers:
- 75% lower utility costs than the average
- Backup power during Florida storms
- 20-year ROI for infrastructure
The community’s microgrid makes it a climate-resilient model. It’s perfect for the 900+ Americans daily moving to Florida for stable energy.
Location Advantages in Southwest Florida
Babcock Ranch is between Fort Myers and Sarasota. It has:
- Access to 3 major job centers in under 45 minutes
- Nature preserves to prevent overdevelopment
- Flood-resistant roads for Category 5 hurricanes
These benefits keep property values stable, even when the market changes. Home prices have risen 18% yearly from 2020.
Developer Insights for Long-Term Investors
The team at Babcock Ranch Homes (518-569-7173) has three main strategies:
- Phased construction: Releasing 100-150 units quarterly
- Price anchoring: Keeping 20% of homes under $350,000
- Climate-proofing: Homes are 2+ feet above flood zones
“We’re building for long-term ownership, not quick sales,” says Syd Kitson. This method ensures steady growth, avoiding the risks of market bubbles.
Investment Strategies During Market Uncertainty
When the economy changes fast, smart investors need to be quick to adjust. They mix safe strategies with bold moves, using data to find new chances. Let’s look at two ways to make your portfolio stronger against market ups and downs.
Diversification Across Property Types
Investing in different types of real estate helps avoid big losses in one area. For example, mixed-use properties did better than single-family homes by 18% in Q1 2024. Here are three areas to consider:
- Multifamily complexes with steady income
- Industrial warehouses near transport hubs
- Medical office buildings in areas with older populations
Places like Raleigh and Nashville have lower costs than big cities but strong demand. Turning old retail spaces into workspaces can bring 34% more profit than building new.
Value-Add Opportunities Identification
Improving properties can turn them into big winners. Look for:
- Properties near new infrastructure
- Places with low upkeep costs
- Areas where you can change zoning
In 2023, renovations brought an average 62% return. Office-to-apartment changes were among the best. Investors should watch local plans and population changes. For example, turning old office parks into senior living near hospitals.
Conclusion
Understanding real estate bubbles is key to making smart choices in unstable markets. The 2008 crash and Japan’s 1990s collapse show how fast speculation can grow. The Case-Shiller Index suggests we must stay alert, as housing prices often return to their mean after 7-10 years.
Babcock Ranch in Southwest Florida is a great example of avoiding bubble risks. It uses solar power and focuses on long-term needs, unlike speculative markets. Developers who focus on cash flow over quick gains are more likely to succeed.
Investors should look at market metrics and location-specific data. Diversifying and finding value-add opportunities helps build a strong portfolio. Watching construction permits and population growth can also help spot issues early.
Real estate cycles favor those who balance caution with opportunity. By using data and models like Babcock Ranch, you can make your portfolio strong. Knowing how to spot a real estate bubble is essential for success.

